

Information Design
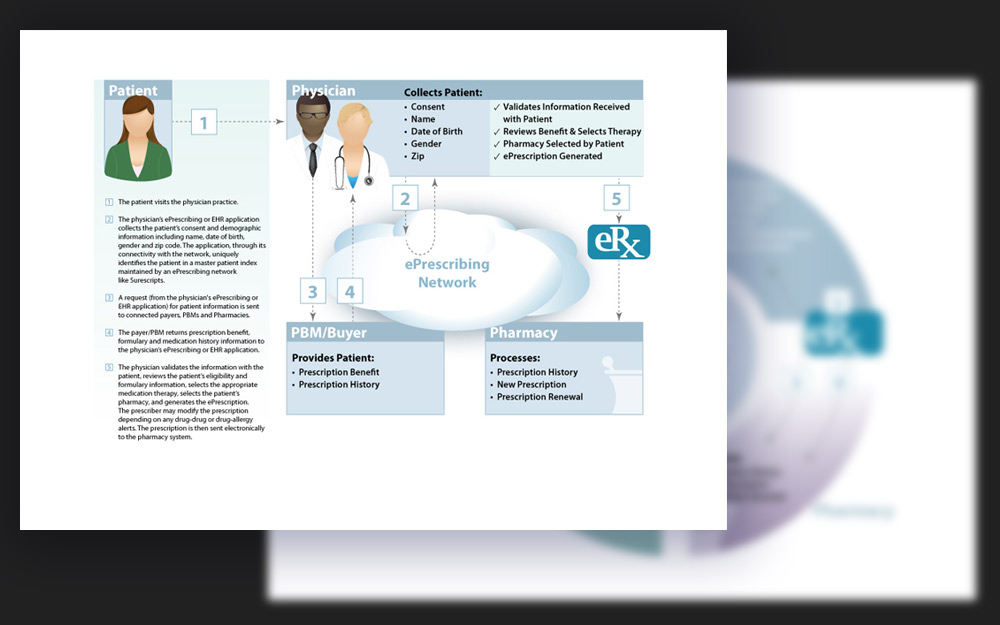
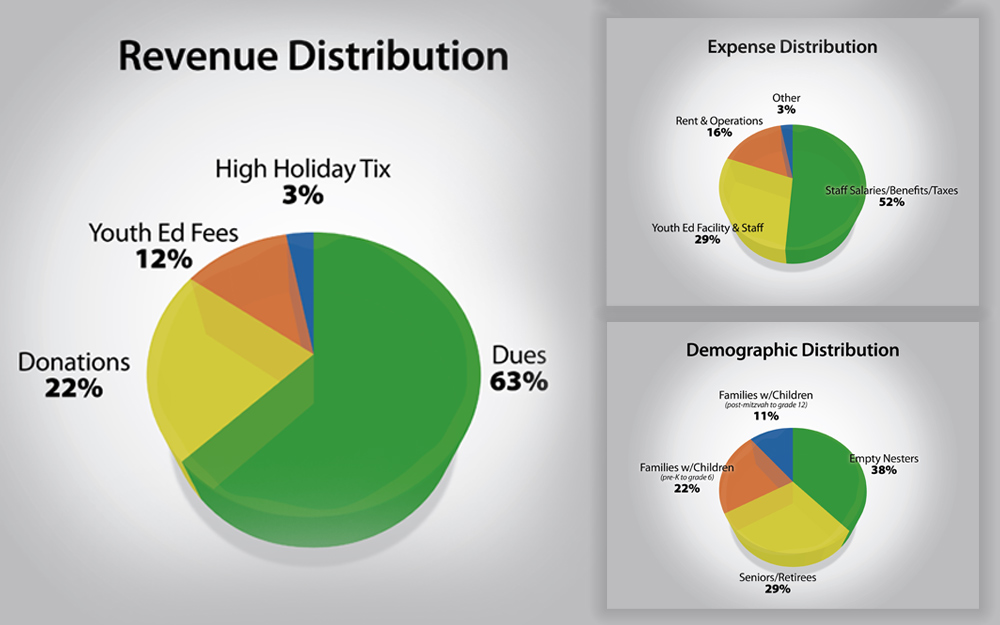
Audiences find systems and concepts much easier to understand when they’re illustrated with clean, well-organized graphs, process diagrams, schematics, or other infographics. For example, the first two images here were draft options explaining the ePrescribing system (as part of the AMA’s Health Information Technology initiative) for an audience conversant in medicine and medical records. The third is a very straightforward pie chart illustration breaking down an organization’s revenues, expenditures, and demographics. And the fourth diagram was produced for a data processing company (a client of Brella Productions at the time).